Defining the blood money phase
The term "blood money" in bitcoin market research refers to capital that is forcibly liquidated during periods of extreme leverage unwinding and infrastructure stress. This is not a metaphorical phrase; it describes a mechanical process where over-leveraged positions are flushed out to restore balance to the system. When the market is saturated with borrowed capital, any sudden shift in liquidity or sentiment can trigger a cascade of sell orders, forcing traders to exit at steep losses.
This phase is characterized by rapid liquidity contraction. As stablecoin reserves dry up and margin calls accumulate, the market experiences a sudden vacuum of buyers. Sellers are forced to dump assets to meet margin requirements, creating a feedback loop that drives prices down sharply. This is the "blood" phase: the painful but necessary cleansing of excess leverage that built up during the preceding bull run.
Understanding this dynamic is critical for tracking the current cycle. The infrastructure stress isn't just about price action; it's about the underlying health of the market's plumbing. When liquidity vanishes, the market becomes fragile, and small triggers can cause disproportionate moves. Recognizing these signals allows investors to distinguish between a healthy correction and a systemic breakdown.
The goal of this research is to identify these inflection points before they become obvious. By monitoring on-chain data and liquidity metrics, we can spot the early signs of this phase. This isn't about predicting the exact bottom, but about understanding the mechanics of the flush so we can manage volatility with clarity.
Liquidity as the Primary Barometer
Forget the halving calendar. For the 2026 infrastructure flows, global liquidity is the only metric that matters. Bitcoin no longer moves in isolation; it acts as a barometer for the global monetary base. When central banks inject liquidity, BTC rises. When they pull it back, BTC falls. This correlation has become stronger than any historical four-year cycle.
Global M2 money supply is the leading indicator. It measures the total amount of a country's money supply, including cash, checking deposits, and highly liquid near money. When this metric expands, capital seeks higher yields and inflation hedges, flowing into Bitcoin. When liquidity contracts, risk assets are the first to be sold off to cover debts or meet margin calls.
The data confirms this shift. Bitcoin’s correlation with global liquidity metrics now outpaces its correlation with traditional risk assets like emerging market equities. This means that macro liquidity conditions override technical patterns. Traders who track global central bank balance sheets will see the trend long before it appears on a BTC chart.
This relationship explains why Bitcoin can decouple from stocks during liquidity injections but crashes in tandem during contractions. The "blood money" market is driven by the cost and availability of capital. Understanding these flows is essential for managing the 2026 landscape.
Reading seller exhaustion signals
When the market crashes, panic is the default reaction. But for those tracking the btc blood money market research, panic is noise. The real signal is silence. Seller exhaustion happens when the last of the weak hands capitulate, and selling pressure dries up even as price stabilizes. Identifying this moment requires looking at two specific data points: funding rates and open interest.
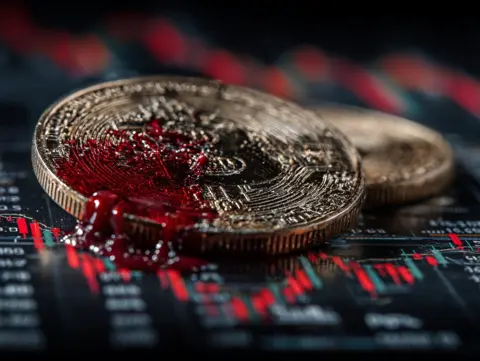
Funding rates represent the cost to hold leveraged positions. When rates are deeply negative, it means shorts are paying longs to keep their positions open. This indicates extreme bearish sentiment. However, deep negative rates often signal that the market is oversold. Look for rates that have dropped significantly below their recent average. This "extreme" reading suggests that most eager sellers have already entered the market, leaving fewer participants willing to push prices lower.
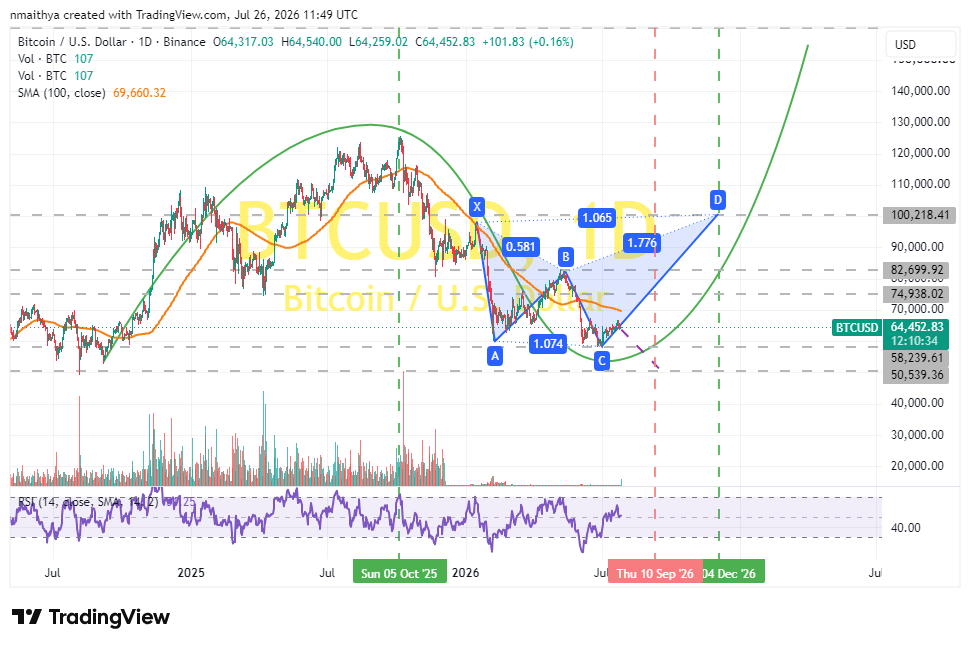
Open interest (OI) measures the total number of outstanding derivative contracts. During a crash, OI typically spikes as traders add to losing positions, only to plummet when those positions are liquidated. Watch for a sharp drop in OI alongside a price floor. This contraction means leverage has been flushed out of the system. When OI falls while price stops dropping, it confirms that sellers are exhausted and the market is no longer being driven by forced liquidations.
The final confirmation is price action itself. After the initial crash, look for the price to move sideways or form a base on declining volume. High volume on the way down indicates distribution; low volume on the way up or sideways indicates a lack of selling pressure. This "quiet" period is where the btc blood money market research becomes most valuable. It shows that the market is transitioning from panic selling to accumulation, setting the stage for a potential reversal.
On-chain holder behavior shifts
The 2024 halving didn’t just cut the block reward; it fundamentally altered the distribution of Bitcoin’s supply. In the "btc blood money market research" context, we track who is holding and who is selling, because that dynamic dictates liquidity during infrastructure stress.
Long-term holders (LTHs) have responded to volatility by moving coins into cold storage rather than exchanges. This "HODL wave" contraction removes sell-side pressure, forcing buyers to absorb supply from a thinner order book. Institutional flows, primarily through Spot ETFs, have added a new layer of passive demand that ignores short-term noise. The result is a market where liquidity contracts sharply during dips, leading to rapid price recovery but higher volatility spikes.
The following comparison highlights the structural differences in supply dynamics between the pre-halving era and the current post-halving landscape.
| Metric | Pre-2024 Halving | Post-2024 Halving | Market Impact |
|---|---|---|---|
| Exchange Reserves | Higher, frequent outflows for trading | Steady decline, long-term storage | Reduced immediate sell pressure |
| LTH Supply | Volatile, frequent profit-taking | Accumulating, lower turnover | Supply shock during demand surges |
| ETF Inflows | N/A | Consistent institutional entry | Absorbs daily mining supply |
| Volatility Profile | Cyclical, driven by retail leverage | Sharp dips, rapid recoveries | Higher infrastructure stress |
This shift means that traditional technical analysis signals based on volume and exchange balance are less reliable. The "blood money" in this market is often trapped in illiquid positions that cannot be exited quickly during stress events. Understanding these on-chain shifts is essential for managing the new supply-demand equilibrium.
Tracking Illicit Flow Infrastructure
The narrative around "blood money" in Bitcoin is rarely about the technology itself, but rather the infrastructure it supports. When regulatory scrutiny intensifies, the market doesn't just react to price; it reacts to the perceived toxicity of the underlying liquidity. This section examines how illicit flows and the subsequent regulatory response create structural friction in the BTC market.
The Scale of Illicit Finance
Estimates on the volume of illegal activity facilitated by Bitcoin vary, but the consensus points to a significant, albeit shrinking, share of total transaction volume. A widely cited policy brief suggests that around $76 billion in illegal activity per year is financed through Bitcoin payments, representing roughly 46% of all transactions at the time of the study. While this figure has likely decreased as the market matured and compliance improved, it remains a primary driver of institutional caution.
This "blood money" label creates a psychological barrier for traditional finance. Even if the majority of BTC is traded by legitimate actors, the presence of illicit infrastructure forces regulators to apply broader restrictions. This results in compliance costs that fall on all market participants, effectively taxing the liquidity pool.
Regulatory Scrutiny and Market Perception
Regulatory bodies are increasingly focused on the intersection of cryptocurrency and political markets, where settlement price manipulation can have outsized effects. A recent Stanford study found evidence of Bitcoin settlement-price manipulation on prediction markets like Polymarket, estimating that 821 suspected traders earned $8.2 million through coordinated activity. Such findings reinforce the narrative that Bitcoin remains vulnerable to exploitation, justifying stricter oversight.
For the average investor, this scrutiny manifests as reduced liquidity and higher volatility during regulatory announcements. The fear of "tainted coins" can lead to temporary liquidity contraction, as exchanges and custodians become more hesitant to process large volumes. This is not just about morality; it is about risk management.
Seller Exhaustion and Liquidity Traps
When illicit flows are exposed, the immediate market reaction is often a spike in selling pressure as bad actors attempt to exit positions. This can create a "liquidity trap," where the lack of willing buyers drives prices down sharply. However, this is often short-lived. Once the initial wash-out occurs, the remaining holders are typically long-term investors, leading to a state of seller exhaustion.
This dynamic is critical for market research. Understanding when illicit flows are driving price action versus when fundamental supply shocks are at play allows traders to distinguish between noise and signal. The key is to monitor on-chain data for unusual transfer patterns that deviate from historical norms, signaling potential regulatory intervention or illicit activity.
Monitoring Infrastructure Flows
Tracking these flows requires looking beyond price charts. On-chain analytics platforms provide real-time data on wallet movements, helping to identify clusters of activity associated with known illicit entities. By monitoring these flows, investors can anticipate regulatory actions and adjust their positions accordingly. This proactive approach mitigates the risk of being caught in a liquidity crunch caused by sudden regulatory crackdowns.
The goal is not to ignore the "blood money" aspect, but to understand its impact on market structure. By recognizing the signs of illicit infrastructure, investors can manage the complexities of the BTC market with greater confidence, avoiding the pitfalls of regulatory overreach and market manipulation.
2026 Risk Checklist: Audit Your Exposure
Before committing capital, run a disciplined audit against the signals that define the btc blood money market research landscape. This checklist helps you separate structural infrastructure shifts from temporary noise.
Check the Federal Reserve’s balance sheet and stablecoin supply. When these metrics contract, liquidity dries up, increasing the risk of sharp price drops. Look for sustained declines rather than daily fluctuations.
Review on-chain data for exchange outflows and long-term holder behavior. If long-term holders are not selling despite price pressure, it suggests seller exhaustion and potential support levels.

Monitor mining difficulty and hash rate. A stable or rising hash rate indicates network security and miner confidence, while a sudden drop can signal capitulation or operational issues.
Analyze the correlation between BTC and the S&P 500 or NASDAQ. High correlation often means crypto is trading as a risk-on asset, making it vulnerable to broader market sell-offs.
Track official announcements from the SEC and CFTC. Regulatory clarity or enforcement actions can significantly impact institutional inflows and market stability.
Use this framework to ground your decisions in data, not sentiment. Consistent monitoring of these five areas provides a clearer picture of the underlying market health.
Common questions on BTC signals
Distinguishing between noise and actual liquidity flows is critical for understanding the BTC blood money market research landscape. Investors often confuse short-term volatility with structural regime shifts. Below, we address specific queries regarding market status and correlation to help you track infrastructure flows accurately.
TechnicalChart symbol="BINANCE:BTCUSDT" chartStyle="candle" interval="1D" indicators='["volume","rsi"]'
Understanding these signals helps you avoid the traps of the BTC blood money market. Always verify claims with primary data sources rather than relying on speculative narratives.
No comments yet. Be the first to share your thoughts!