Defining the BTC Blood Money metric
The term "BTC Blood Money" describes a specific analytical framework for tracking forced liquidations and liquidity exhaustion, rather than general market volatility or casual trading strategies. It is not a financial advice guide but a method for identifying where high-stakes, high-volatility infrastructure plays are likely to trigger cascading liquidations.
In this context, "blood money" refers to the capital that gets wiped out when leveraged positions are forcibly closed. This happens when the market moves against heavily leveraged traders, causing their positions to be liquidated by exchanges. This process creates a feedback loop: liquidations drive prices down (or up), which triggers more liquidations, leading to rapid liquidity exhaustion.
Tracking this metric helps analysts understand the underlying pressure points in the market. It distinguishes between organic price movements driven by fundamental supply and demand, and artificial movements caused by the unwinding of leveraged positions. By focusing on these forced liquidations, we can better anticipate periods of extreme volatility and potential trend reversals.
Understanding the difference between normal market noise and "blood money" events is crucial for navigating the high-stakes environment of cryptocurrency trading. It allows for a more precise interpretation of price action and liquidity flows, providing a clearer picture of the market's true health.
Tracking liquidity heatmaps
Mapping where forced liquidations occur requires looking past simple price levels to the underlying leverage structure. We use on-chain data to identify "blood money" pools—zones where high-stakes leverage accumulates and where a price move triggers a cascade of automated exits. This is not about guessing direction; it is about locating the friction points in the market infrastructure.
The visual representation of this data often resembles a topographic map. Brighter zones indicate higher concentrations of open interest and potential liquidation cascades. When Bitcoin moves into these zones, the resulting volatility is not random; it is the market digesting the excess leverage that built up during the quiet periods.
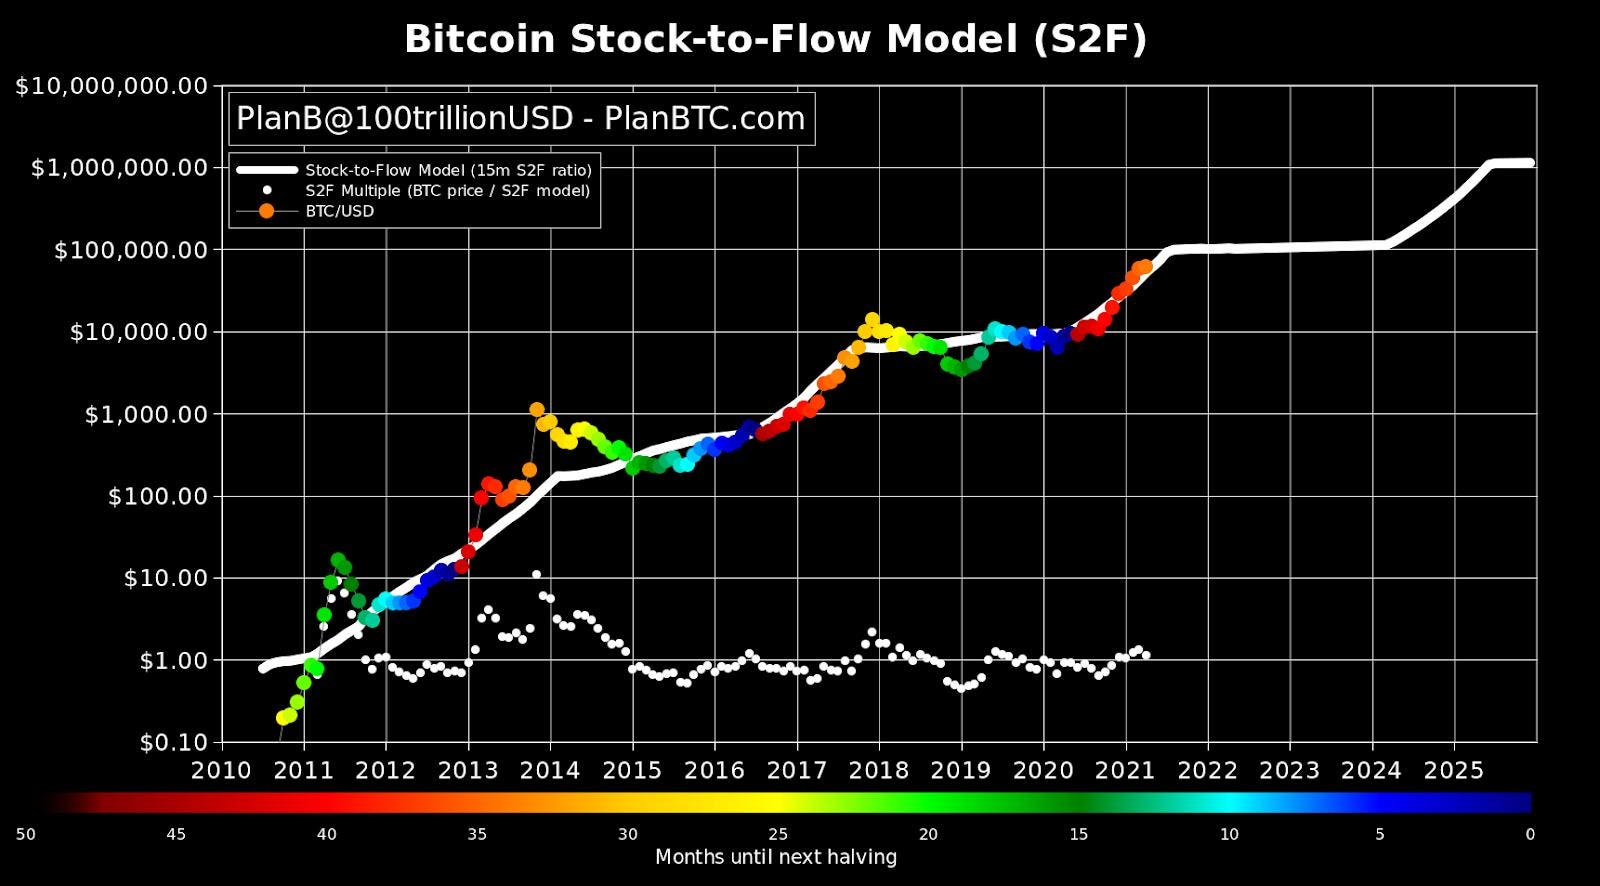
To track these shifts in real time, we rely on provider-backed charts that overlay price action with leverage heatmaps. This allows us to see the immediate pressure points as they form, rather than reacting to them after the fact. The chart below shows the current BTC/USD structure, highlighting the areas where liquidity is most thin and vulnerable to sharp reversals.
Reading on-chain exhaustion signals
When Bitcoin price action stalls, the real story is often hidden in the ledger. "BTC Blood Money" analysis relies on specific on-chain indicators to identify when liquidity is stretched thin. These signals mark the difference between a healthy correction and a forced liquidation cascade. By tracking exchange reserves, the Spent-Spent Output Ratio (SSR), and funding rates, we can spot the precise moments when market participants are over-leveraged and vulnerable.
Exchange Reserves: The Liquidity Pool
Exchange balances act as a direct proxy for available sell-side liquidity. When reserves climb, it suggests accumulation or preparation for distribution; when they drop sharply, it indicates coins moving to cold storage, reducing the immediate supply available for panic selling. A rapid decline in reserves often precedes a supply shock, as fewer coins are available to absorb buy pressure. Conversely, sudden spikes in exchange inflows can signal impending selling pressure from long-term holders or miners.
SSR: Identifying Distribution
The Spent-Spent Output Ratio (SSR) measures the ratio of outputs that have been spent to those that have not. It is a powerful tool for identifying whether old coins are being moved to sell or simply reorganized. An SSR spike above 1.0 typically indicates that coins held for a long time are being spent, often marking a distribution phase where early adopters exit positions. Sustained high SSR values suggest that the market is shedding long-term holdings, which can lead to increased volatility and potential downward pressure.
Funding Rates: Sentiment Extremes
Funding rates reflect the cost of maintaining leveraged positions. In a perpetual swap market, positive funding rates mean longs pay shorts, indicating bullish sentiment and potential over-leverage. Negative rates suggest shorts are dominating. Extreme positive funding rates often signal a crowded trade, making the market susceptible to a "long squeeze" if price fails to rise. Similarly, deeply negative rates can indicate capitulation, setting the stage for a short squeeze. Monitoring these rates helps identify when sentiment has become detached from fundamentals.
Metric Comparison Framework
The following table compares these key on-chain metrics, their typical signals, and their implications for market direction. Use this framework to contextualize real-time data.
| Metric | Signal | Implication | Trader Action |
|---|---|---|---|
| Exchange Reserves | Sharp Decline | Supply Shock | Watch for upward breakouts |
| Exchange Reserves | Sudden Spike | Sell Pressure | Prepare for downward moves |
| SSR | > 1.0 | Distribution | Caution on long positions |
| SSR | < 0.7 | Accumulation | Look for entry points |
| Funding Rates | Extremely Positive | Long Squeeze Risk | Reduce leverage |
| Funding Rates | Extremely Negative | Short Squeeze Risk | Watch for quick reversals |
Mapping the infrastructure layer
Before diving into the volatility, you need a secure, verified pipeline. The term "BTC blood money" describes high-stakes, high-volatility infrastructure or speculative plays. It is not a casual trading strategy. To analyze these shifts accurately, your setup must prioritize data integrity and security over speed.
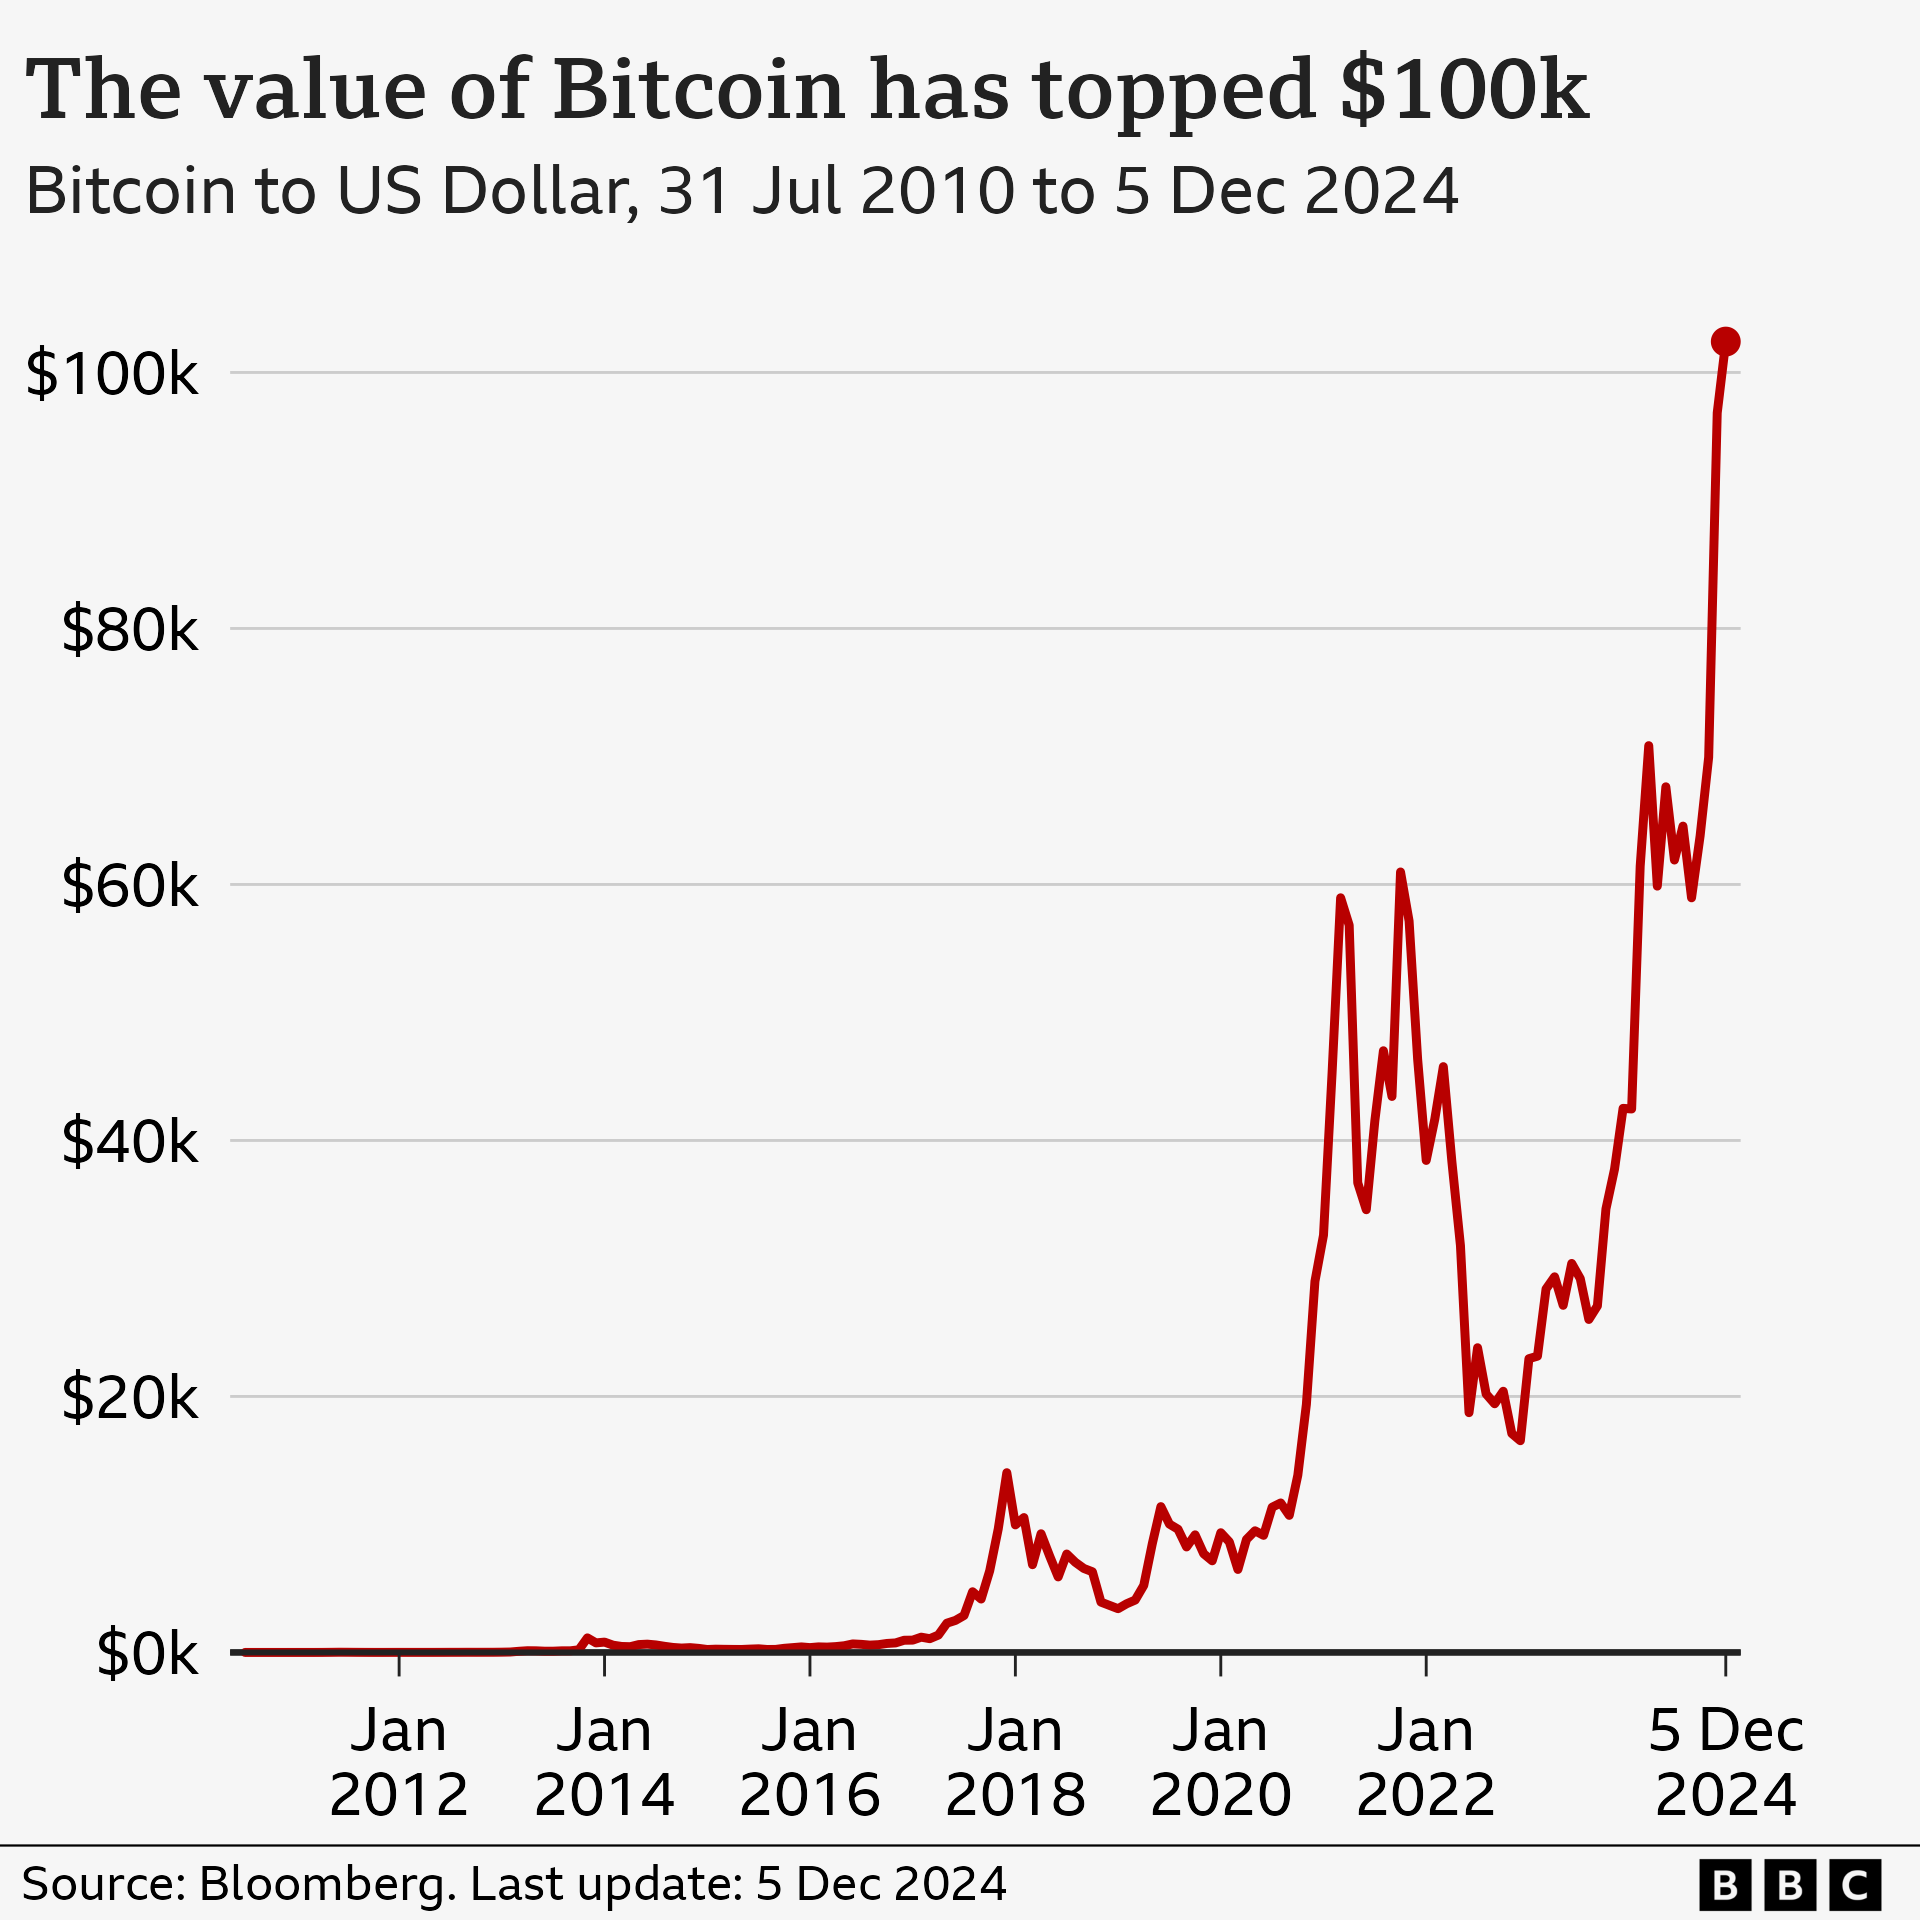
Start by identifying on-chain data providers that offer raw, unfiltered transaction histories. Avoid aggregated dashboards that may obscure the underlying liquidity flows. Cross-reference at least two primary sources to ensure the volume data matches the price action you see on exchanges. If the data doesn't align, the analysis is compromised before it begins.
High-stakes analysis requires high-stakes security. Use a hardware wallet for any capital involved in these positions. Never keep funds on an exchange or in a hot wallet connected to your primary browser. The infrastructure layer must be isolated from the general internet to prevent keyloggers or remote access trojans from compromising your private keys.
Static charts are insufficient for this type of analysis. You need provider-backed widgets that update in real-time. Use a TechnicalChart to monitor the 1D candle structure alongside volume indicators. This allows you to spot sudden liquidity injections or withdrawals that signal a shift in the market's direction. Relying on cached data is like driving with a rear-view mirror.
Once your pipeline is secure, you can focus on the data itself. The goal is to separate noise from signal. By verifying your sources and securing your entry points, you ensure that any conclusions drawn are based on reality, not manipulation or error. This infrastructure is the foundation of any serious BTC blood money analysis.
No comments yet. Be the first to share your thoughts!