Defining the btc blood money analysis framework
The term "BTC blood money" is often misunderstood as a reference to a specific asset, token, or financial product. It is not. Instead, it describes a high-stakes market environment characterized by extreme volatility, speculative infrastructure shifts, and the rapid transfer of wealth between participants. This framework focuses on the mechanics of these shifts rather than the hype.
In this context, "blood money" refers to the capital deployed in markets where leverage is high and sentiment is fragile. The analysis framework examines how on-chain data, exchange flows, and macroeconomic indicators signal these high-risk periods. It is a tool for understanding the stress points in the crypto infrastructure, not a guide to chasing trends.
This approach prioritizes clarity over speculation. By stripping away the sensationalism, we can focus on the structural changes in the market that define these volatile periods. The goal is to provide a clear, evidence-based perspective on how these shifts impact the broader ecosystem.
How infrastructure shifts shape market resilience
The crypto market no longer operates on a single, fragile ledger. It has fractured into a layered ecosystem where Layer 2 networks and decentralized liquidity pools dictate the speed and cost of capital. These infrastructure shifts are not merely technical upgrades; they are the new fault lines that determine where "blood money" is made and where it is lost. When infrastructure is robust, volatility is absorbed. When it is thin, leverage becomes a weapon.
The Layer 2 Liquidity Trap
Layer 2 (L2) solutions like Arbitrum, Optimism, and Base have moved the bulk of retail volume off Ethereum mainnet. While this reduces gas fees, it fragments liquidity. In 2026, a trader might find deep order books on one L2 and near-empty ones on another. This fragmentation creates arbitrage opportunities for sophisticated players but leaves retail traders exposed to slippage and price dislocation during stress events.
Think of the market as a river system. Mainnet is the main channel, slow and deep. L2s are tributaries. In calm weather, the tributaries flow smoothly. But during a market shock, the tributaries can dry up instantly, trapping capital. This is the new environment for blood money: high-speed, high-leverage trading in shallow waters.
Correlation with Global Liquidity
Despite the internal complexity, Bitcoin remains a global liquidity barometer. As noted by analysts like Lyn Alden, BTC’s price action increasingly mirrors global liquidity trends rather than just domestic crypto sentiment [src-serp-5]. When central banks tighten, liquidity drains from the peripheral L2s first. The "blood" is drawn from the edges before it hits the core. Understanding this hierarchy is critical for resilience.
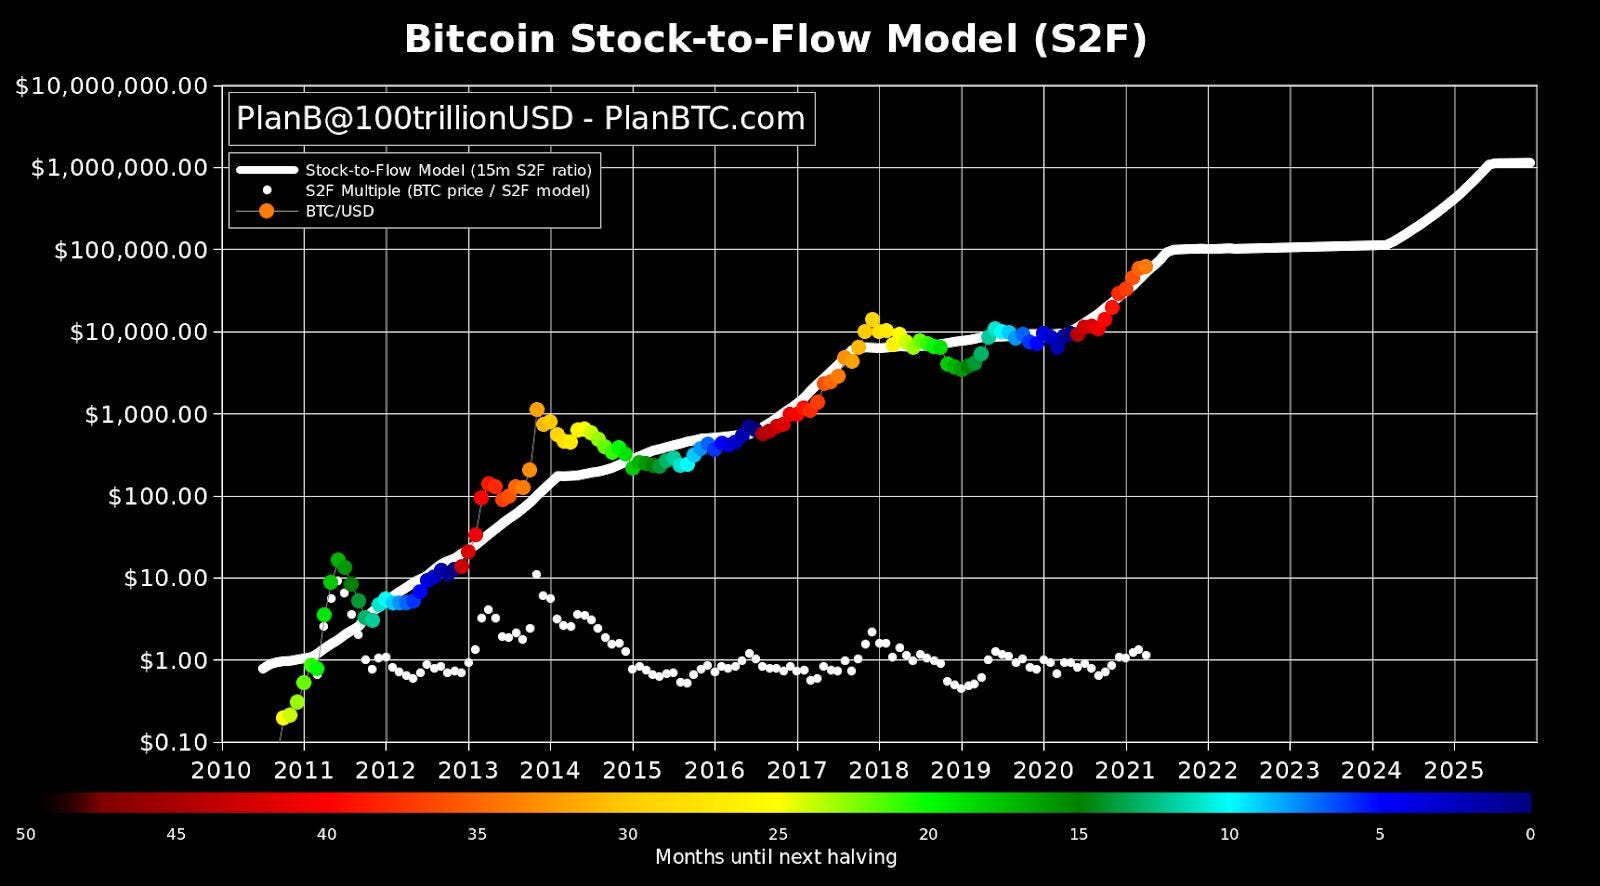
Visualizing the Shift
The following chart illustrates the correlation between BTC price action and network hash rate, a key indicator of mining infrastructure health. Notice how periods of hash rate stagnation often precede volatility spikes, signaling that the infrastructure is struggling to absorb selling pressure.
Technical Context
The chart below shows BTC/USD price action alongside network difficulty adjustments. Difficulty adjustments are the infrastructure’s automatic response to hash rate changes. When price drops but difficulty remains high, miners are forced to sell, accelerating the "blood money" cycle. Watch for divergences between price and difficulty as early warning signs of infrastructure stress.
On-chain market research strategies
Identifying "blood money"—capital that is volatile, speculative, or driven by panic—requires looking past price charts and into the ledger. On-chain data reveals where the real money is moving, exposing whale accumulation, exchange inflows, and liquidity shifts before they hit the order book. This is not about guessing; it is about reading the transaction history of the market itself.
Start by tracking large wallet movements. Whales often move significant BTC to exchanges before a sell-off or withdraw to cold storage before a long-term hold. Tools like Glassnode or CryptoQuant provide real-time dashboards for exchange net flows. A sudden spike in exchange inflows from known whale addresses is a red flag for potential selling pressure. Conversely, large withdrawals to unknown addresses often signal accumulation.
Next, monitor the HODL Wave and liquidity metrics. These indicators show how long coins have remained dormant. When long-term holders start spending their coins after years of dormancy, it often marks a market top. When short-term holders are forced to sell at a loss during a dip, it can indicate a bottom. Understanding these cycles helps you distinguish between healthy correction and genuine capitulation.
The image below illustrates the liquidity dynamics that often precede major market shifts. It visualizes how capital flows in and out of the Bitcoin ecosystem, providing a macro view of market health.
To put this data in context, here is the current live price of Bitcoin. This widget provides the real-time baseline against which you measure on-chain activity.
Essential btc blood money tools for research
You cannot navigate a market shift like this with guesswork. The 2026 infrastructure requires a specific stack of tools to track capital flight and identify the "blood money" leaving the ecosystem. Using the right software separates signal from noise when volatility spikes.
Charting and On-Chain Data
TradingView remains the standard for visualizing price action and volume. For this analysis, you need more than basic candles; you need to overlay on-chain metrics to see if the drop is driven by long-term holders selling or short-term panic. Pair this with Glassnode or CryptoQuant to track exchange inflows and outflows in real time.
Security and Execution
When markets are bleeding, security is paramount. A hardware wallet like the Ledger Nano X or Trezor Model T is non-negotiable for storing assets you are not actively trading. For execution, use a dedicated monitor or laptop with a secure, verified browser profile to avoid phishing attempts that target high-stakes traders during volatile periods.

As an Amazon Associate, we may earn from qualifying purchases.
Live Market Data
Stay connected to the live market without relying on cached data. The following widget provides real-time BTC pricing to help you gauge the depth of the current shift.
Common mistakes in volatile market analysis
When Bitcoin drops hard, the temptation to declare the infrastructure broken is overwhelming. This is the first and most costly error: confusing a liquidity panic with a structural failure. A sharp price decline is often a feature of the market’s volatility, not a bug in its core protocol. Mistaking the two leads to selling at the bottom or ignoring genuine signals buried in the noise.
The second mistake is treating short-term volatility as long-term evidence. Traders often extrapolate a week of red candles into a multi-year bear case. This ignores the cyclical nature of crypto markets and the lagging indicators that actually confirm regime changes. If you are watching Polymarket odds or similar derivative data, remember that these reflect sentiment, not necessarily the underlying network health.
Finally, many analysts fail to distinguish between systemic risk and noise. A sudden drop might be triggered by a single exchange issue or a large liquidation cascade, not a flaw in Bitcoin’s consensus mechanism. To avoid this, anchor your analysis in on-chain metrics and official node data rather than price action alone. Let the protocol’s behavior dictate your thesis, not the ticker’s mood swings.
Frequently asked: what to check next
Why is the crypto market called a "bloodbath"?
The term "bloodbath" describes a severe market crash where asset values plummet rapidly. Recent analysis suggests rising odds of Bitcoin falling below $50,000, with prediction markets flashing a nearly 50% probability [1]. This language reflects the high-stakes nature of these shifts, where liquidity dries up and panic selling accelerates losses.
Why do they call it "blood money"?
"Blood money" typically refers to profits gained from unethical or tragic events. In crypto, this has been applied to meme coin creators who profited millions following real-world tragedies, such as the assassination of influencer Charlie Kirk [2]. The term highlights the ethical void in trading off human suffering for digital gain.
Is "blood money" based on a true story?
The concept is grounded in real incidents of market exploitation. While not tied to a single narrative film, the term accurately describes documented cases where traders used automated bots to front-run news events, securing millions in profits while others suffered losses.
Is "blood money" worth watching?
For investors, monitoring these trends is critical for risk management. Understanding the mechanics behind "blood money" attacks helps traders identify when market movements are driven by predatory behavior rather than fundamental value, allowing for better defensive positioning.
No comments yet. Be the first to share your thoughts!