Defining the blood money metric
In crypto market analysis, "blood money" is a visceral shorthand for the capital destroyed during leveraged liquidations. It does not refer to illicit funds or illegal proceeds. Instead, it describes the financial "bloodshed" that occurs when forced sell-offs evaporate liquidity, triggering cascading margin calls across the market.
This metric quantifies the cost of market volatility. When prices drop sharply, traders holding highly leveraged long positions are forcibly closed out. The resulting volume creates a feedback loop: selling pressure drives prices lower, which triggers more liquidations, further accelerating the decline.
Tracking these liquidation events provides a clearer picture of market health than price action alone. For instance, recent analysis of a major BTC price plunge below $100,000 revealed over $1.1 billion in liquidated leveraged positions, highlighting the sheer scale of capital wiped out in a short window 1. By monitoring these flows, analysts can identify points of seller exhaustion and potential reversal zones where the "blood" has finally been squeezed out of the system 2.
Tracking liquidity and liquidations
The term "blood money" in crypto trading refers to the forced closure of leveraged positions when prices move against traders. This process, known as liquidation, creates a self-reinforcing cycle of selling pressure. During a downturn, identifying where these liquidations occur helps you spot temporary support and resistance levels that might not be visible on standard candlestick charts.
Liquidation heatmaps visualize this data by showing clusters of pending orders. These clusters act like magnets for price action; as the market dips, it often gravitates toward these zones to trigger the necessary volume for a reversal or continuation. Monitoring these zones allows you to anticipate where the "blood" will pool and how much volatility might follow.
Volume spikes often accompany these liquidation events. A sudden surge in volume indicates that a significant number of positions are being closed simultaneously. This data point is critical for distinguishing between a genuine trend change and a temporary liquidity grab. By tracking these metrics, you can better understand the underlying strength of the market move.
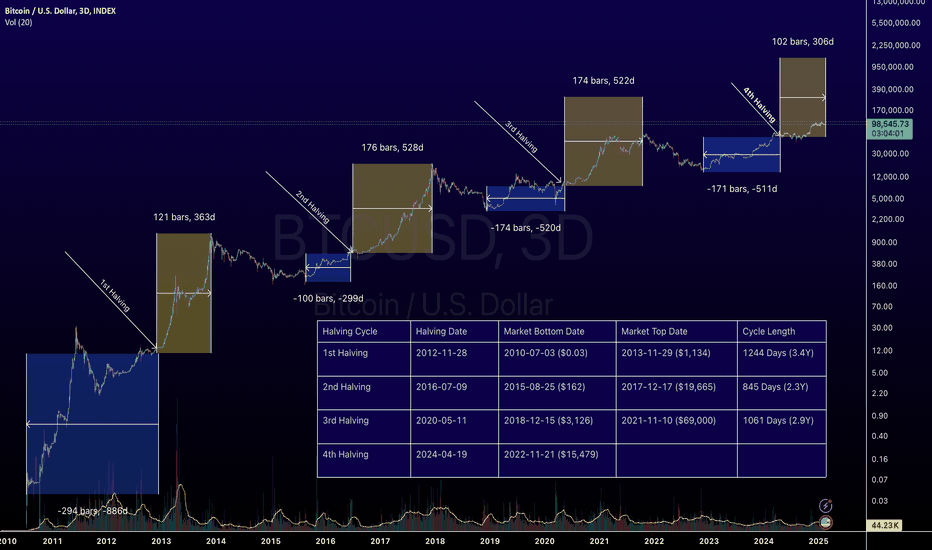
To visualize this dynamic, consider how price interacts with key technical levels during high volatility. The chart below illustrates a typical BTC/USD movement, highlighting the kind of volatility and volume shifts that often precede or follow major liquidation events.
Tools for market research
When volatility spikes, your ability to process data quickly separates survival from liquidation. During a "blood bath," manual charting is too slow; you need automated alerts and secure hardware that doesn't rely on cloud connectivity for basic operations. The right stack minimizes latency and maximizes security.
Hardware wallets
Secure storage is non-negotiable when managing positions during high-stakes volatility. Hardware wallets keep private keys offline, protecting your assets from exchange hacks or remote exploits. For this environment, prioritize devices with open-source firmware and clear display screens for address verification.


As an Amazon Associate, we may earn from qualifying purchases.
Real-time charting platforms
Visualizing liquidity and order flow is critical. TradingView remains the industry standard for real-time technical analysis, offering deep integration with major exchanges. Its alert system allows you to set price triggers based on complex indicators, ensuring you react to market shifts without staring at screens all day.
On-chain data trackers
Price action is often a lagging indicator of on-chain activity. Tools like Glassnode or CryptoQuant provide insights into whale movements, exchange inflows, and liquidation heatmaps. These metrics help you distinguish between a temporary dip and a structural shift in market sentiment, allowing for more informed entry and exit points.
Comparing analysis platforms
Tracking "blood money" events—sharp liquidity flushes and rapid deleveraging—requires more than just a price chart. You need to see where the stops are being hunted and how order books react in real time. Different data providers offer varying levels of granularity, cost, and reliability when it comes to these high-stakes volatility spikes.
The table below breaks down three major platforms often used by traders to monitor these extreme market conditions. We compare them based on their ability to track liquidation data, real-time depth, and overall cost.
| Platform | Liquidation Data | Real-Time Depth | Cost |
|---|---|---|---|
| Binance Square | Basic | High | Free |
| TradingView | Limited | Medium | Freemium |
| Glassnode | Advanced | N/A | Paid |
Binance Square offers free access to basic liquidation feeds and high-frequency order book depth, making it a solid starting point for spotting immediate liquidity grabs. However, its analytical tools are relatively shallow compared to dedicated on-chain or advanced technical platforms.
TradingView is the industry standard for technical charting. While its free tier is robust, accessing detailed liquidation heatmaps or advanced depth-of-market visualizations often requires a paid subscription. It excels at drawing support/resistance levels but may lag in providing the raw, tick-by-tick liquidation data needed for ultra-short-term volatility trading.
Glassnode and similar on-chain analytics firms provide the deepest insight into long-term holder behavior and exchange flows. They are less about second-by-second price action and more about understanding the structural shifts that precede a "bloodbath." This data is typically behind a paywall but offers a different, more fundamental perspective on market stress.
When choosing a platform, match the tool to your timeframe. If you are trading the immediate aftermath of a volatility spike, real-time depth from an exchange like Binance is critical. If you are analyzing the broader market structure leading up to the event, on-chain data from Glassnode provides the necessary context. Combining both gives you a complete picture of the blood money flow.
Live price and trend monitoring
Use this section to make the BTC Blood Money Analysis decision easier to compare in real life, not just on paper. Start with the reader's actual constraint, then separate must-have requirements from details that are merely nice to have. A practical choice should survive normal use, maintenance, timing, and budget. If a recommendation only works in an ideal situation, call that out plainly and give the reader a fallback path.
The simplest way to use this section is to write down the must-have criteria first, then compare each option against those criteria before weighing nice-to-have features.
No comments yet. Be the first to share your thoughts!