Defining the BTC Blood Money metric
The term "BTC Blood Money" describes a specific analytical framework for tracking forced liquidations and liquidity exhaustion, rather than serving as generic market slang. This metric focuses on the mechanical collapse of leveraged positions, identifying the precise price levels where stop-losses trigger cascading sell-offs.
In this context, "blood money" refers to the liquidity harvested when highly leveraged long or short positions are forcibly closed by exchanges. These events often create sharp, violent price movements that deviate from fundamental trends, driven purely by the need to cover margin calls.
By monitoring these liquidity pools, we can anticipate volatility spikes before they occur. This approach shifts the focus from reactive trading to proactive risk management, allowing for better positioning ahead of major infrastructure shifts in the Bitcoin network.
Tracking liquidity heatmaps
Identifying where "blood money" is trapped requires looking beyond simple price action to the underlying liquidity pools. In Bitcoin markets, forced selling often clusters around specific price levels where leverage has accumulated. These zones act as magnets for price movement, as market makers and algorithms hunt for the liquidity needed to fill large orders.
To track these areas, you need to visualize the order book depth and open interest. A liquidity heatmap overlays these data points onto a price chart, highlighting zones of high concentration. When price approaches these dense zones, the likelihood of a sharp reversal or a violent liquidation cascade increases significantly. This isn't just about support and resistance; it's about where the market's pain points are located.
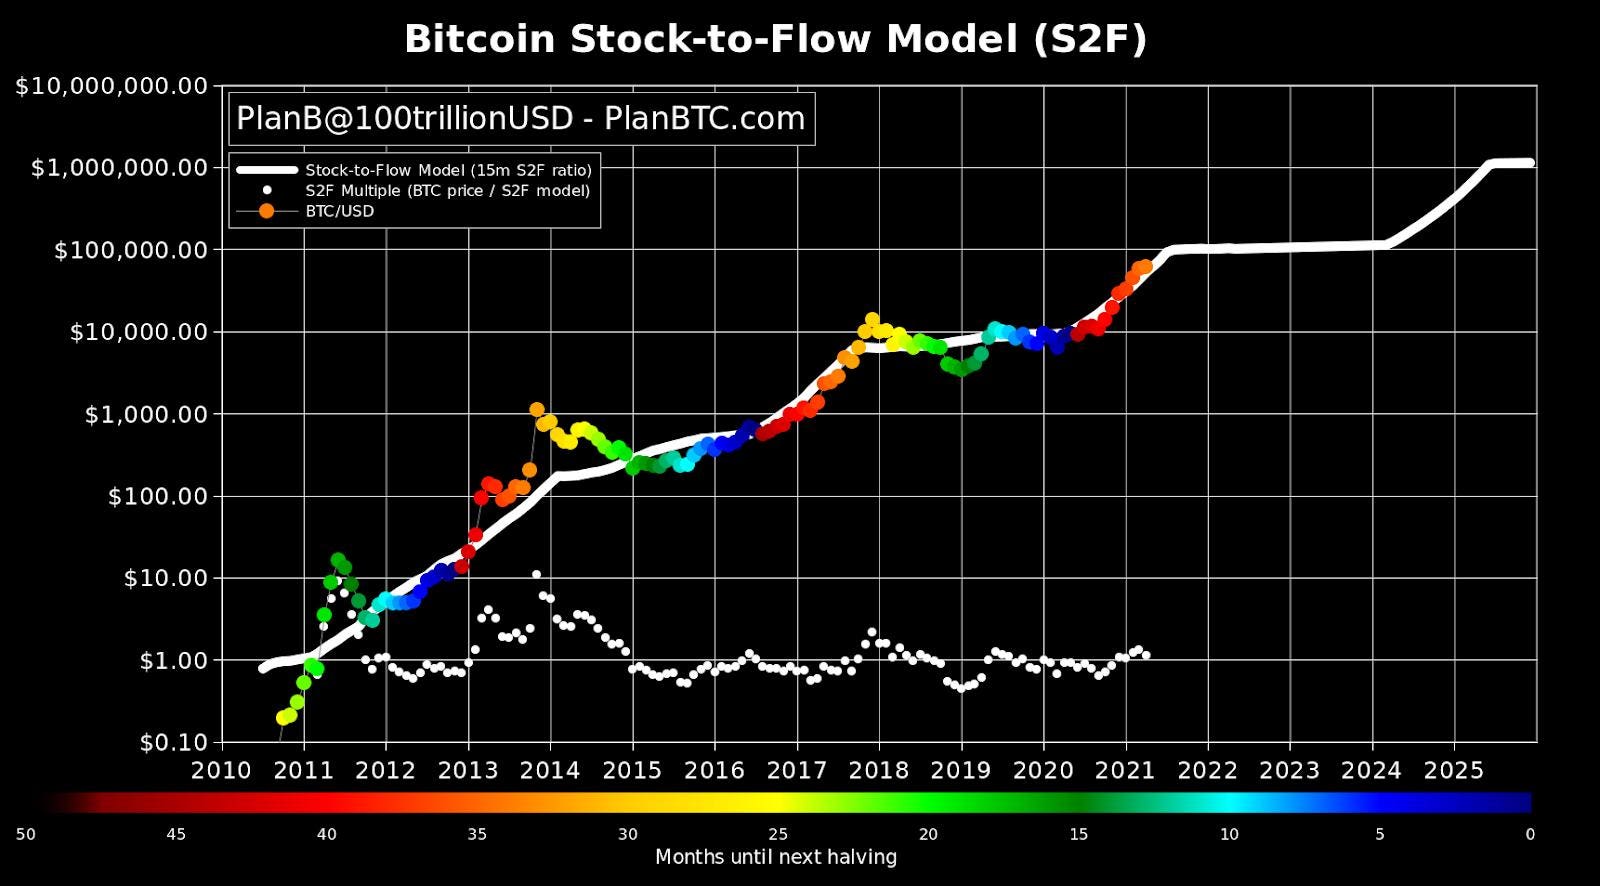
The
above shows Bitcoin's price action. While this view focuses on price and volume, professional analysts layer liquidation heatmaps on top to see where long and short positions are most vulnerable. By monitoring these heatmaps, you can anticipate where forced selling might trigger a cascade, allowing you to position ahead of the "blood bath" rather than getting caught in it.Focus on high-volume nodes where price has spent significant time. These are the areas where institutional and retail leverage often builds up. When price retests these zones, the resulting volatility can be extreme. Tracking these shifts helps you understand the infrastructure changes driving the current market structure, turning chaotic price swings into predictable liquidity events.
Reading on-chain exhaustion signals
After a blood bath, the price action is only half the story. The real signal comes from the data moving behind the scenes. Traders need to distinguish between temporary panic and genuine capitulation where sellers are actually running out of ammunition. This section breaks down the specific on-chain metrics that confirm when the selling pressure has finally hit a wall.
Exchange Reserves Hit Multi-Year Lows
One of the clearest indicators of seller exhaustion is the steady decline in Bitcoin held on centralized exchanges. When reserves drop, it means holders are moving their coins to cold storage or self-custody wallets. This behavior signals a strong conviction to hold rather than sell.
Historically, when exchange balances reach multi-year lows, it creates a supply shock. With fewer coins available to trade on open markets, even modest buying pressure can drive prices up. This is not just a technicality; it represents a structural shift in who holds the asset. If you see reserves continuing to fall while the price stabilizes, it suggests that weak hands have already been washed out.
Stablecoin Supply Ratio (SSR) Indicates Dry Powder
The Stablecoin Supply Ratio (SSR) measures the amount of stablecoins relative to the total market cap of Bitcoin. A low SSR means there is a large supply of stablecoins chasing a smaller market cap, which often precedes a rally. Conversely, a high SSR indicates that the market is saturated with cash that hasn't been deployed yet, which can act as a drag on price.
During a blood bath, you want to watch for the SSR to cool down. If the ratio drops while prices are still falling, it suggests that buyers are actively absorbing the supply. This "dry powder" is essential fuel for the next leg up. Without it, any price bounce is likely to be short-lived and quickly sold into.
Funding Rates Turn Negative
Funding rates in the perpetual futures market provide a real-time snapshot of trader sentiment. When funding rates are deeply negative, it means shorts are paying longs to hold their positions. This often happens when the market is overly bearish and leveraged shorts are piling in.
While negative funding can persist for a while, extreme negativity often marks a local bottom. It indicates that the market is crowded on one side. When the last of the leveraged sellers are forced to cover their positions, it creates a short squeeze that can accelerate price recovery. Watching for a shift from negative to neutral funding is a key sign that the panic is subsiding.
MVRV Z-Score Enters Oversold Territory
The Market Value to Realized Value (MVRV) Z-Score compares the current market cap to the average price at which all coins last moved. When this metric enters oversold territory, it suggests that Bitcoin is trading significantly below its "fair value" based on recent holder behavior.
This is a lagging indicator, but it is powerful for confirming exhaustion. If the MVRV Z-Score has dropped from extreme highs to extreme lows, it means the market has moved from a state of euphoria to one of despair. This cycle completion is a necessary precursor to any sustained recovery. It confirms that the asset is no longer overvalued and has room to correct upward.
On-Chain Volume Divergence
Finally, look for divergence between price and on-chain transaction volume. During a blood bath, volume often spikes as panic selling accelerates. However, if you start to see volume declining while the price continues to drop, it suggests that the selling pressure is drying up.
This divergence indicates that fewer participants are willing to sell at these lower prices. It is a quiet signal that the market is running out of sellers. When combined with other exhaustion metrics, this volume contraction provides strong evidence that the worst of the selling is over.
Navigating 2026 infrastructure shifts
The speed and depth of a BTC blood money event are no longer determined by market sentiment alone. They are dictated by the plumbing of the ecosystem itself. In 2026, the infrastructure surrounding Bitcoin has shifted from a fragmented experimental space to a consolidated institutional backbone. This change acts as both a shock absorber and a potential amplifier, depending on how liquidity is routed during a crisis.
Layer 2 scaling solutions have become the primary pressure valve for transactional stress. When network congestion spikes, L2s handle the volume, keeping base layer fees manageable. However, during a sharp downturn, the interplay between L2 liquidity pools and mainnet settlement can create temporary bottlenecks. Traders moving rapidly off-exchange may find their transactions stuck in mempool limbo, forcing them to sell on centralized exchanges at a discount. This friction deepens the bloodbath by concentrating selling pressure in fewer, more liquid venues.
Institutional custody and regulatory clarity have also altered the dynamics of panic. With major banks and regulated custodians holding a larger share of spot Bitcoin ETFs, the "sell wall" is higher but also more rigid. Institutional protocols often require time for internal risk checks before executing large liquidations. This delay can prevent the immediate cascade of margin calls seen in earlier cycles, but it may also lead to a sudden, synchronized dump once risk thresholds are breached. The result is less frequent but potentially more severe infrastructural shocks.
Regulatory changes in 2026 have further standardized reporting and compliance, reducing the opacity that once allowed hidden leverage to build up unnoticed. While this transparency is healthy for long-term stability, it means that when a blood money event occurs, the data is visible in real-time. Investors can see the liquidation heatmaps and exchange outflows as they happen, which can accelerate herd behavior. Understanding these infrastructure shifts is critical for any BTC blood money analysis, as the plumbing now defines the flow of capital during stress events.
Avoiding Common Liquidation Traps
In a BTC Blood Money analysis, the goal isn't just to predict the drop, but to survive it. Traders often become the "blood" themselves by ignoring market structure and over-leveraging into liquidity pools. The sudden collapse that triggers a crypto bloodbath is rarely random; it is a hunt for weak hands.
When panic sets in, as seen during recent tariff-driven sell-offs, forced liquidations cascade prices into free fall. To avoid being the liquidity source for institutional players, you must manage your leverage with discipline.
Pre-Trade Checklist
Use this list to ensure your position can withstand volatility before you enter the market.
-
Set Stop-Losses Below Key Support: Place stops outside the noise of normal fluctuations, not just below your entry.
-
Reduce Leverage: High leverage amplifies small moves into catastrophic losses. Keep it low enough to survive a 5-10% wick.
-
Check Liquidity Zones: Identify where other traders have likely placed stops. Avoid entering exactly where the "blood" is concentrated.
-
Monitor Macro News: Sudden regulatory or tariff announcements can trigger immediate flash crashes. Stay alert to headlines.
By respecting these rules, you shift from being the victim of the market to a participant who understands the game.
Why is there a crypto bloodbath?
When Bitcoin and altcoins flash-crash, it rarely happens in a vacuum. The sudden collapse is usually the result of a specific trigger—often macroeconomic news or regulatory shifts—that exposes fragile market structures. For instance, recent volatility spiked following the U.S. government’s announcement of new tariffs on Chinese tech imports, a move that rattled investors and triggered panic selling across digital assets.
However, the mechanics of a "bloodbath" go deeper than headlines. According to Joshua Duckett, director of investigations at a crypto forensic firm, these crashes are driven by forced liquidations. When leverage is high, a small price drop triggers margin calls, forcing traders to sell positions to cover debts. This cascade sends prices into free fall, creating the "blood money" liquidity traps that define these cycles.
Understanding this dynamic is central to any BTC Blood Money analysis. It shifts the focus from "why did the price drop?" to "who got liquidated?" By tracking these forced sell-offs, you can distinguish between organic market correction and structural liquidity crises.
No comments yet. Be the first to share your thoughts!