Tracking the 2026 Market Shift
The phrase "blood money" often conjures images of panic selling and emotional capitulation. In 2026, however, the term has evolved into a structural metric for tracking liquidity shifts rather than just sentiment. This analysis focuses on the infrastructure changes driving market volatility, moving away from sensationalism to examine how capital flows are being redefined.
The current market context is defined by a transition from speculative retail dominance to institutional infrastructure maturity. We are seeing a decoupling of price action from narrative hype, replaced by a focus on on-chain liquidity depth and settlement layer efficiency. Understanding this shift requires looking at the data behind the headlines, not just the headlines themselves.
To ground this analysis in current reality, we are using provider-backed widgets for real-time data. This ensures that our assessment of market conditions is based on live liquidity and price action, not stale snapshots or theoretical models. The following chart and price widget reflect the current state of Bitcoin's market structure.
Reading on-chain liquidity signals
Narrative drives headlines, but liquidity drives prices. When Bitcoin faces a "blood money" event—where capital is forcibly removed from the market through liquidations or panic selling—the on-chain data tells the story long before the price chart confirms it. To navigate these infrastructure shifts, you must look past the noise and focus on the movement of coins between hot wallets, exchanges, and stablecoin reserves.
The primary signal to watch is the net flow of Bitcoin into and out of exchange wallets. When large volumes move off exchanges into cold storage, it indicates accumulation and reduced sell-side pressure. Conversely, sudden influxes into exchange wallets often precede a liquidity drain. This isn't just about volume; it's about velocity. A rapid spike in exchange inflows, especially when paired with rising stablecoin supply, suggests that sellers are preparing to offload, while buyers are sitting on the sidelines with dry powder.
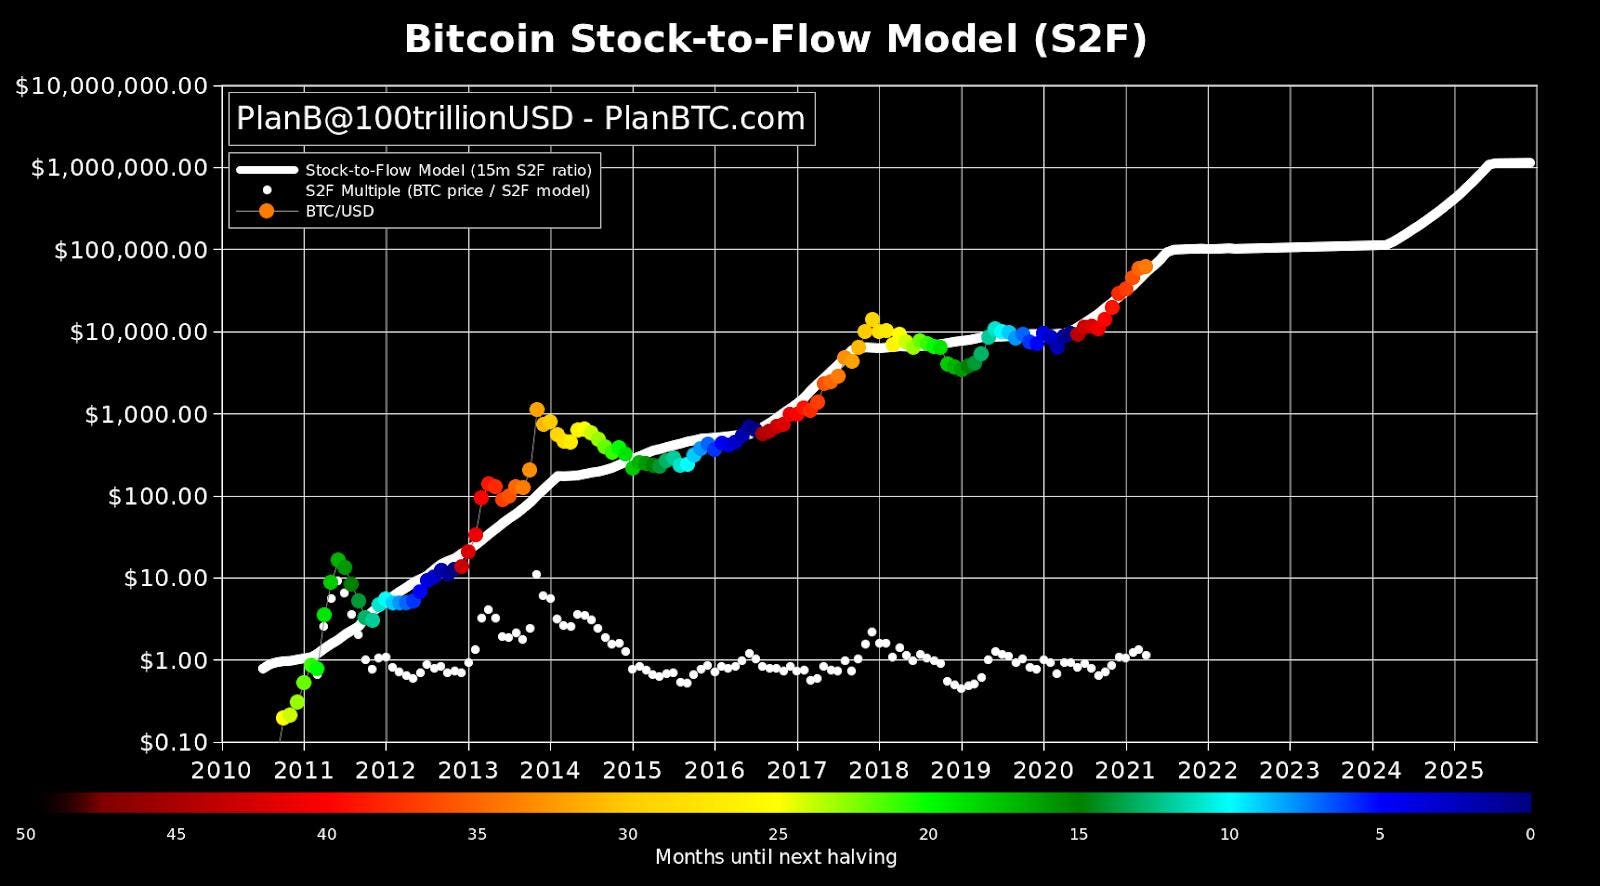
Stablecoin supply acts as the fuel for these moves. When USDT or USDC supply expands rapidly, it often signals incoming liquidity that can push prices up. However, if stablecoin supply contracts while Bitcoin prices remain flat or drop, it indicates that capital is fleeing the ecosystem entirely. This divergence is a critical warning sign. It suggests that the "blood" is not just being spilled on leveraged positions, but is being withdrawn from the market altogether.
Taint analysis offers a deeper layer of insight into where this money is going. By tracing the "taint" of coins—tracking their history through the blockchain—you can identify if funds are moving toward known exchange deposit addresses or toward OTC desks. This method, as detailed in academic research on money flow patterns, allows analysts to distinguish between normal retail activity and coordinated institutional movement. If you see a cluster of taint flows converging on major exchanges, it is often a precursor to a liquidity event.
Finally, monitor the interaction between spot volume and derivatives open interest. A price drop accompanied by a surge in open interest and declining spot volume indicates that shorts are building up, potentially setting the stage for a short squeeze or a cascade of liquidations. Conversely, if spot volume remains high while open interest drops, it suggests genuine selling pressure from long-term holders. Understanding these dynamics helps you anticipate infrastructure shifts rather than just reacting to them.
Mining infrastructure costs and liquidity shifts
The 2026 Bitcoin market isn't just reacting to price action; it is responding to a fundamental shift in how mining infrastructure operates. As energy costs stabilize and hardware efficiency plateaus, the margin between operational revenue and infrastructure expense has narrowed. This compression forces miners to make critical decisions about liquidity, directly impacting the availability of BTC on exchanges.
Historically, miners acted as a steady source of sell pressure, liquidating daily production to cover operational expenditures. However, the structural changes in 2026 have altered this dynamic. With higher upfront capital requirements for next-generation ASICs and fluctuating regional energy tariffs, many mid-tier miners are holding inventory rather than selling immediately. This reduction in immediate sell-side liquidity can amplify volatility during market dips, as the buffer of steady miner supply vanishes.
To understand the scale of this shift, we can compare the operational metrics of pre-2026 mining setups against the current infrastructure standards. The data below highlights the divergence in efficiency and cost structures that define the current market landscape.
| Metric | 2024 Standard | 2026 Infrastructure | Market Impact |
|---|---|---|---|
| Hashrate per kW | ~30 TH/kW | ~45 TH/kW | Lower energy burn reduces baseline sell pressure. |
| Hardware Capex | $0.12 per TH | $0.18 per TH | Higher debt service requires longer holding periods. |
| Daily Liquidity | High (Immediate Sale) | Moderate (Hedged/Deferred) | Reduced immediate exchange inflows during dips. |
| Energy Contract Type | Spot Market Heavy | Long-Term Fixed | Predictable costs allow for strategic inventory management. |
This structural evolution means that traditional indicators of miner capitulation are less reliable. When prices drop, miners with long-term energy contracts and higher-capex hardware are less likely to panic-sell. Instead, they may hedge or defer sales, creating a liquidity vacuum that can lead to sharper price swings. Understanding this infrastructure shift is essential for interpreting 2026 market movements, as the supply side is no longer a passive, predictable force.
Avoid common blood money analysis mistakes
When analyzing capital flows during a "blood money" event, the temptation is to focus on the immediate price action. However, confusing short-term volatility with long-term infrastructure failure is a critical error. A sharp drop in liquidity does not necessarily indicate a collapse in the underlying protocol's utility or settlement layer.
Instead of reacting to the panic, look at the settlement data. Are transactions still settling? Is the hash rate stable? These metrics provide a clearer picture of network resilience than the 24-hour candlestick chart.
Monitor infrastructure health
To separate signal from noise, you must monitor the actual health of the Bitcoin network during these turbulent periods. Price is a lagging indicator of sentiment; infrastructure metrics are leading indicators of structural integrity.
When analyzing blood money flows, focus on on-chain volume and active addresses rather than just the dollar value. A drop in dollar value can be driven by fiat devaluation or exchange liquidity issues, not necessarily a loss of faith in the protocol itself. By tracking these deeper layers, you avoid the trap of mistaking a market correction for an infrastructure failure.
Building a 2026 Research Checklist
The 2026 landscape requires a shift from reactive news-chasing to proactive infrastructure tracking. To conduct a meaningful BTC blood money analysis, you need a framework that prioritizes liquidity flows and miner solvency over price action. This checklist ensures you are evaluating the structural health of the market rather than just the headline number.
Miners are the first line of defense against infrastructure decay. Check if the hash rate is holding steady or if there is a sudden drop-off indicating capitulation. Low hash rate often precedes significant price discovery events as selling pressure from miners increases.
Stablecoin supply is a leading indicator of fresh capital entering the ecosystem. A shrinking stablecoin supply suggests investors are rotating into cash or other assets, while expansion signals readiness to buy. Monitor exchange reserves to see if liquidity is moving in or out of the crypto ecosystem.
Distinguish between speculative selling and long-term holder distribution. When long-term holders begin moving coins to exchanges, it often signals a shift in sentiment. Use on-chain data to see if these movements are for trading or for cold storage, which indicates confidence.
Bitcoin does not exist in a vacuum. Watch the Federal Reserve’s balance sheet and global M2 money supply. Tightening liquidity conditions typically pressure risk assets, while expansionary policies provide the fuel for infrastructure growth and price appreciation.
This checklist is not a prediction tool; it is a diagnostic framework. By focusing on these four pillars, you remove the noise of daily volatility and focus on the underlying mechanics of the market. The chart below provides a real-time view of the asset you are analyzing, grounding your research in current data rather than historical patterns.
Why the market crashes feel personal
The term "blood money" in crypto usually points to two things: extreme volatility driven by macro shocks, or the ethical gray areas of profiting from tragedy. In 2026, the market is less a casino and more a leveraged plumbing system. When liquidity dries up, the "crash" is often just forced liquidation cascading through under-collateralized positions.
What causes a crypto bloodbath?
A sudden collapse rarely happens in a vacuum. It typically follows a sharp macro trigger—like new tariffs, unexpected inflation data, or regulatory announcements—that rattles institutional confidence. As seen in past volatility spikes, these events force traders to liquidate positions rapidly. This creates a feedback loop where falling prices trigger more margin calls, sending assets into free fall regardless of underlying utility.
Is the current volatility a buying opportunity?
Volatility is a feature, not a bug, of the current infrastructure. For long-term holders, dips often represent accumulation zones. For leveraged traders, they are ruin events. The key is distinguishing between structural breaks in liquidity and temporary panic. Watch the stablecoin dominance and on-chain volume; if liquidity remains deep, the "bloodbath" is likely a correction, not a collapse.
How does Bitcoin behave during these shifts?
Bitcoin often acts as the canary in the coal mine. During high-stress liquidity events, it may dip alongside altcoins but typically recovers faster due to its deeper order books and institutional support. However, it is not immune to systemic shocks. The 2026 landscape shows that BTC’s stability is relative; it still requires significant capital inflows to absorb large sell-offs.
No comments yet. Be the first to share your thoughts!